
So I noticed on the TaxProf Blog that the newest crop of ABA 509 Information Reports on accredited law schools came out recently. It’s good that the ABA has begun to release this data. It can help students look at trends at schools over time. Unfortunately, there are only reports from 2011 to date available. Whenever some official body like the ABA or the LSAC dumps of numbers, I like to dig around for a bit and see what I can find. For the past couple of years I’ve done it with LSAC data that indicated that top university students are avoiding law schools, and schools where there have been increases in law schools applicants (2013, 2014). The general theme was that “the best and brightest students” from top schools have been shying away from going to law school. And that lower ranked schools were increasingly sending more students to law school.
For a lark (and because I’m stuck at home sick with the flu), I decided to go through some of the 509 reports and pull data. I picked the Top Ten schools as listed in Above The Law’s Top 50 Law School Rankings (represent) to see if any particular trends were visible. I also choose the ten lowest ranked schools according to US News & World Report’s Best Law School Rankings (note, I choose the bottom ranked schools, not those listed as “unranked”). I pulled out three sets of data to compare. GPA percentiles, LSAT percentiles, and matriculant percentage change from 2011 to 2014.
GPA Percentiles
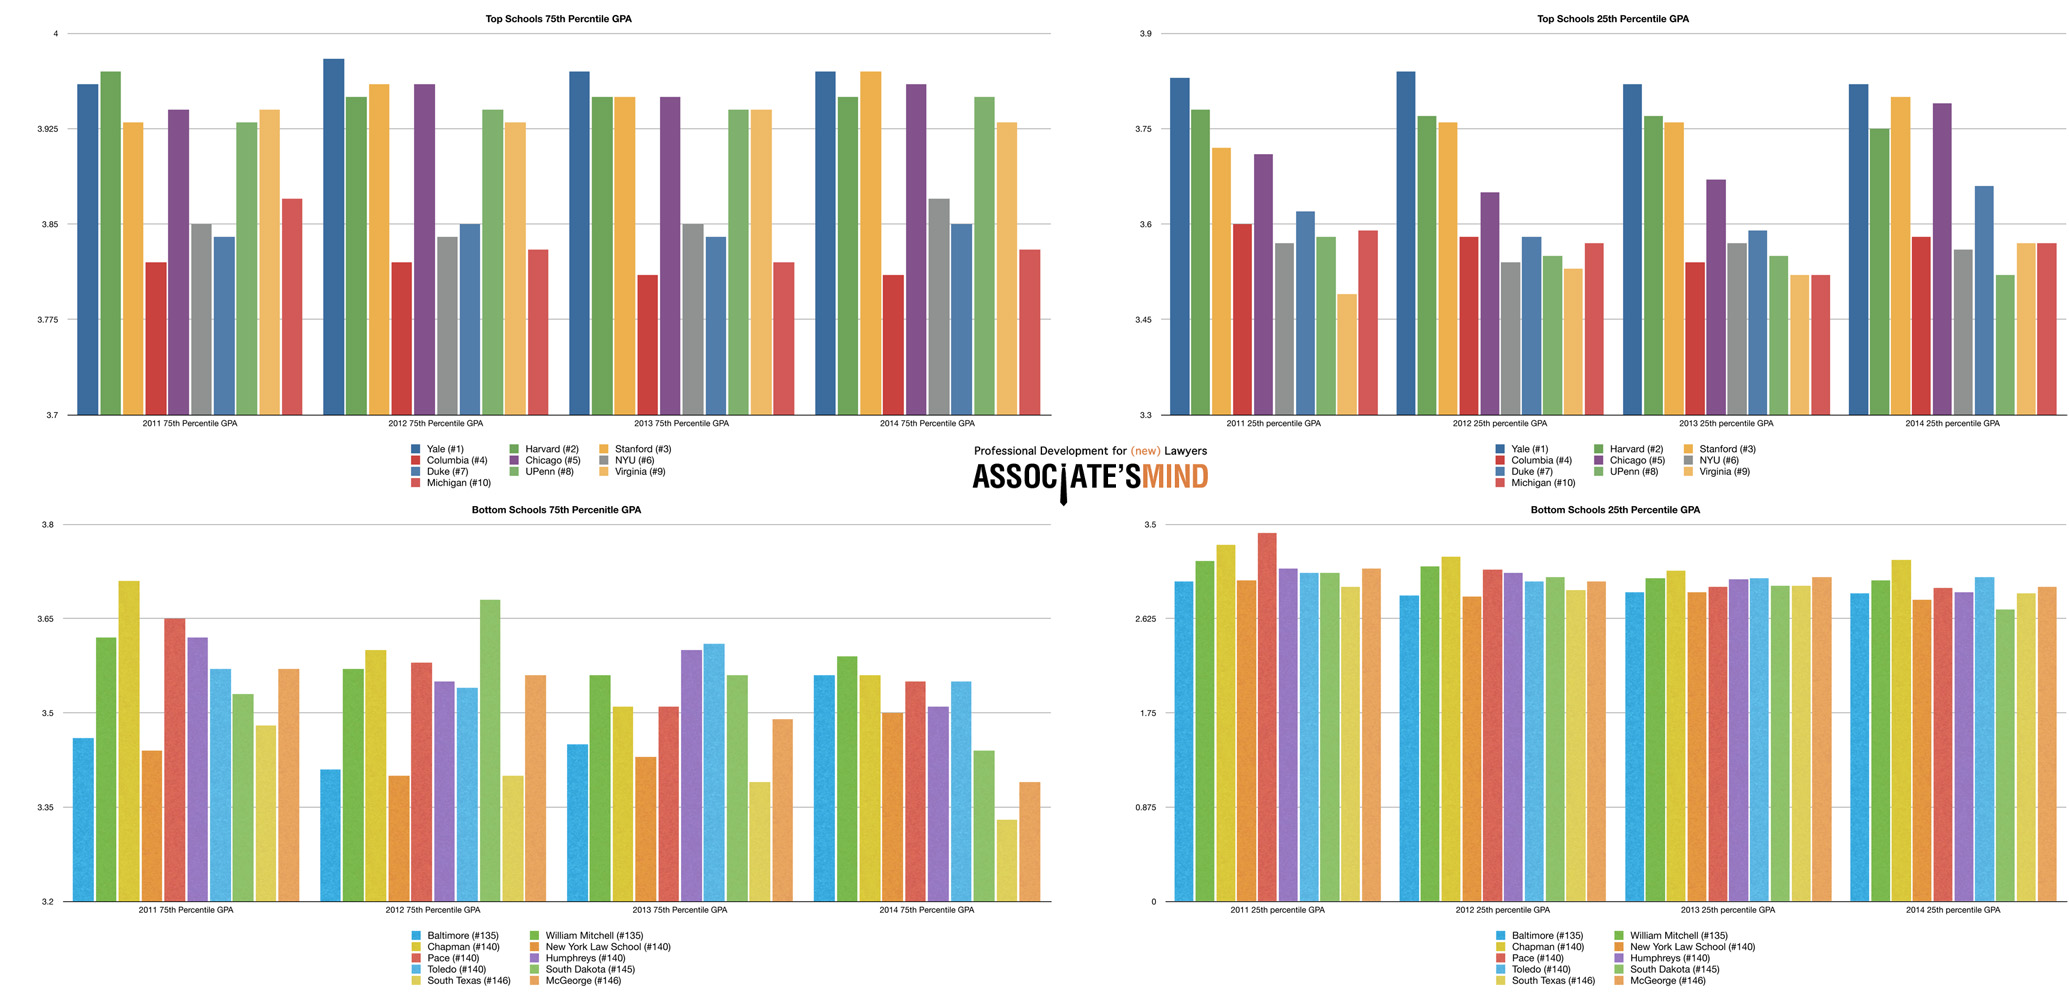
Click for large version.
As is to be expected, the 75th and 25th percentiles at the top schools has remained largely flat. The real change comes at the bottom ranked schools. While the 25th percentile has remained largely flat, it’s because it doesn’t really have any lower to go (look at the axis). But there has been a steady decline in the GPA of the 75th percentile. Not good.
LSAT Percentiles
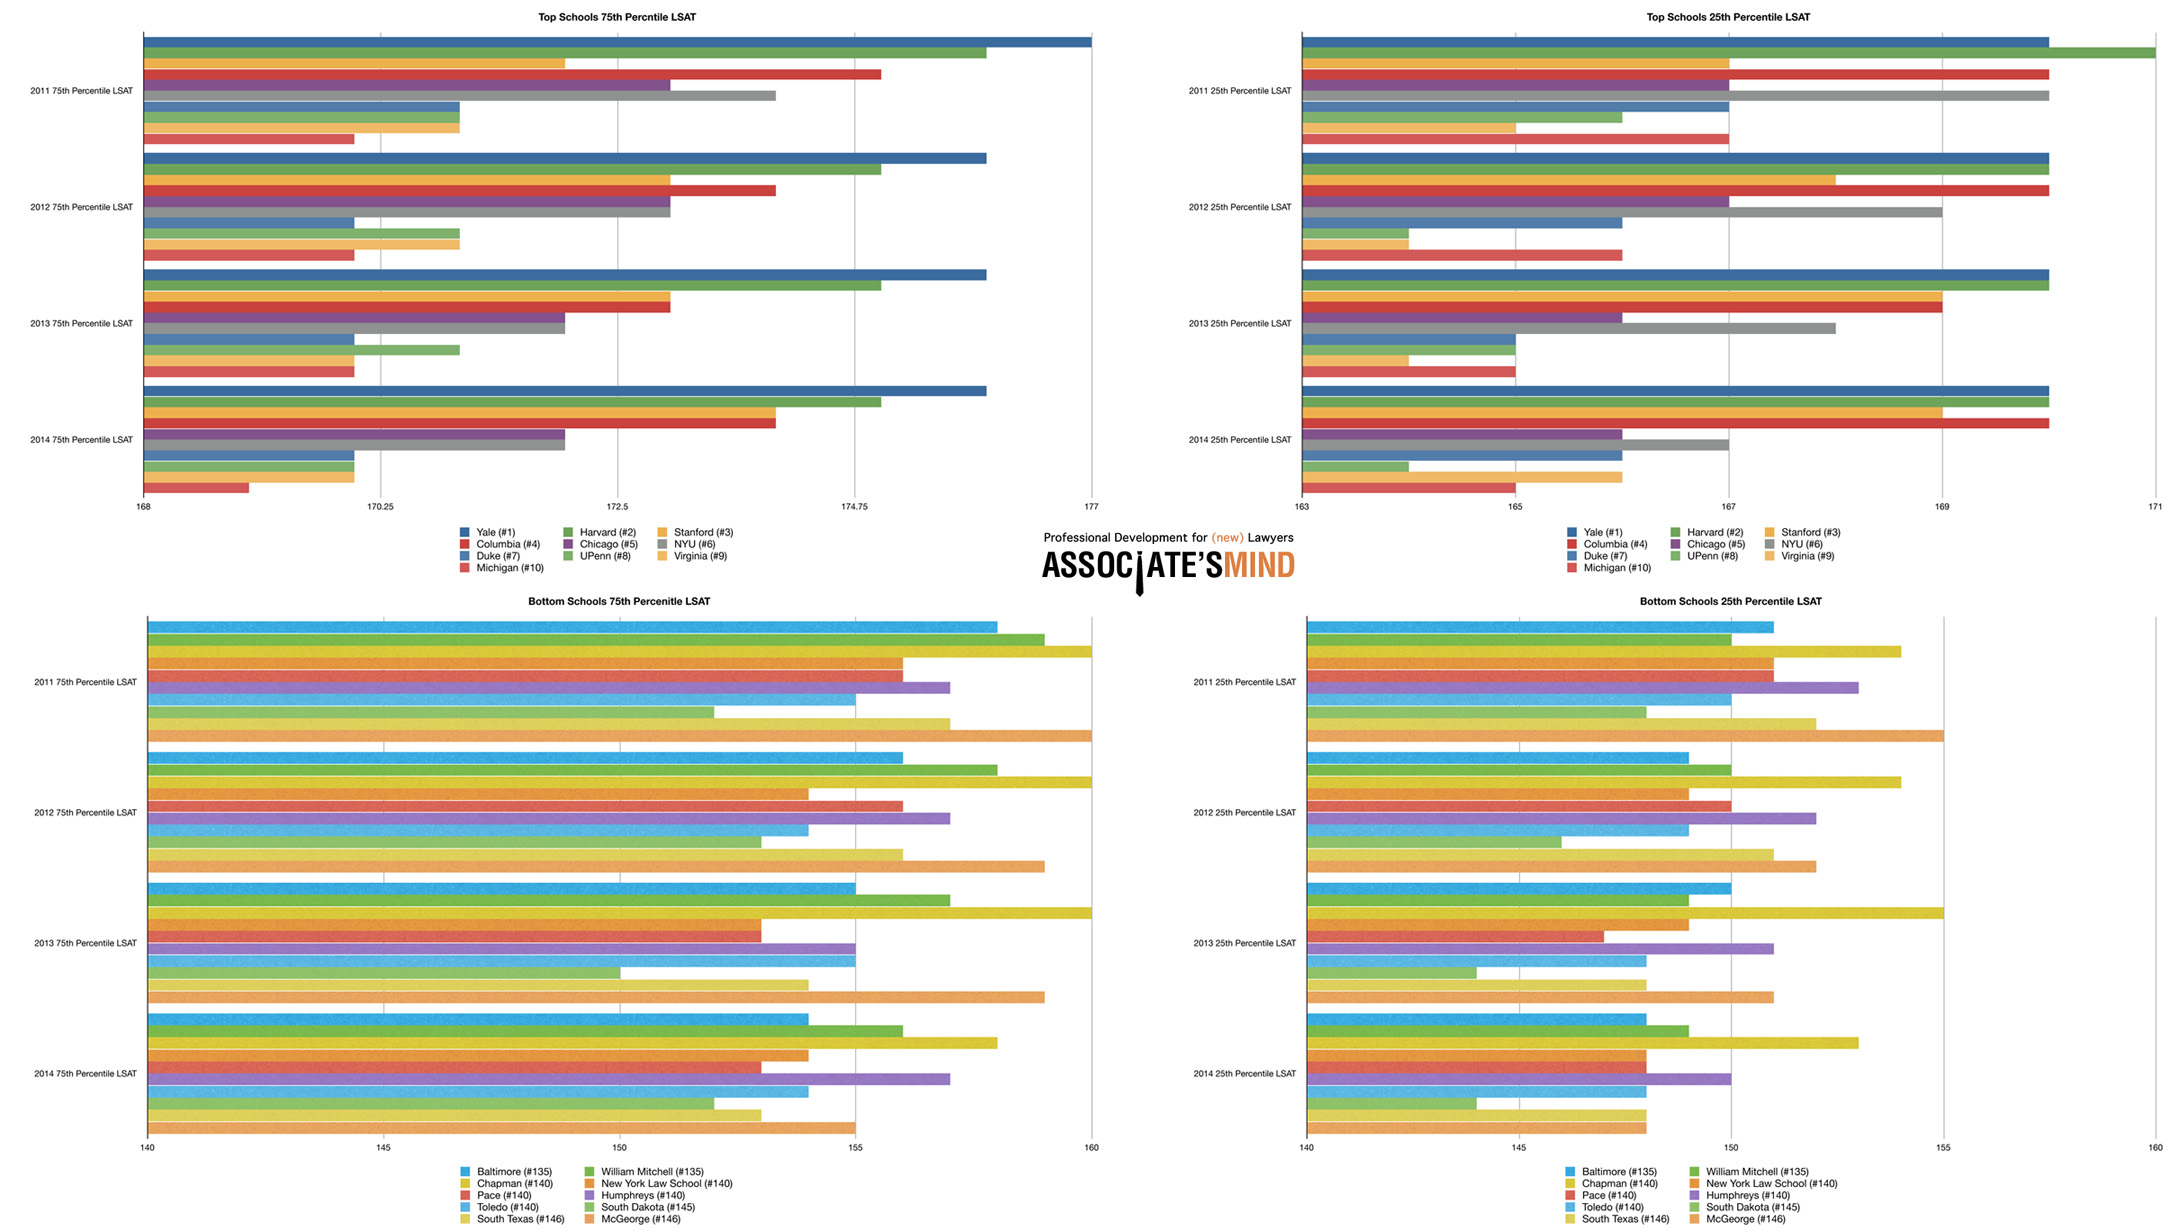
Click for huge version.
Aha! Now here is a change across the board. LSAT scores, both at 75th/25th percentile and at Top/Bottom schools are trending downwards. While the change at the top schools is minimal, it is still trending downwards.
Matriculant Percentage Change From 2011 to 2014
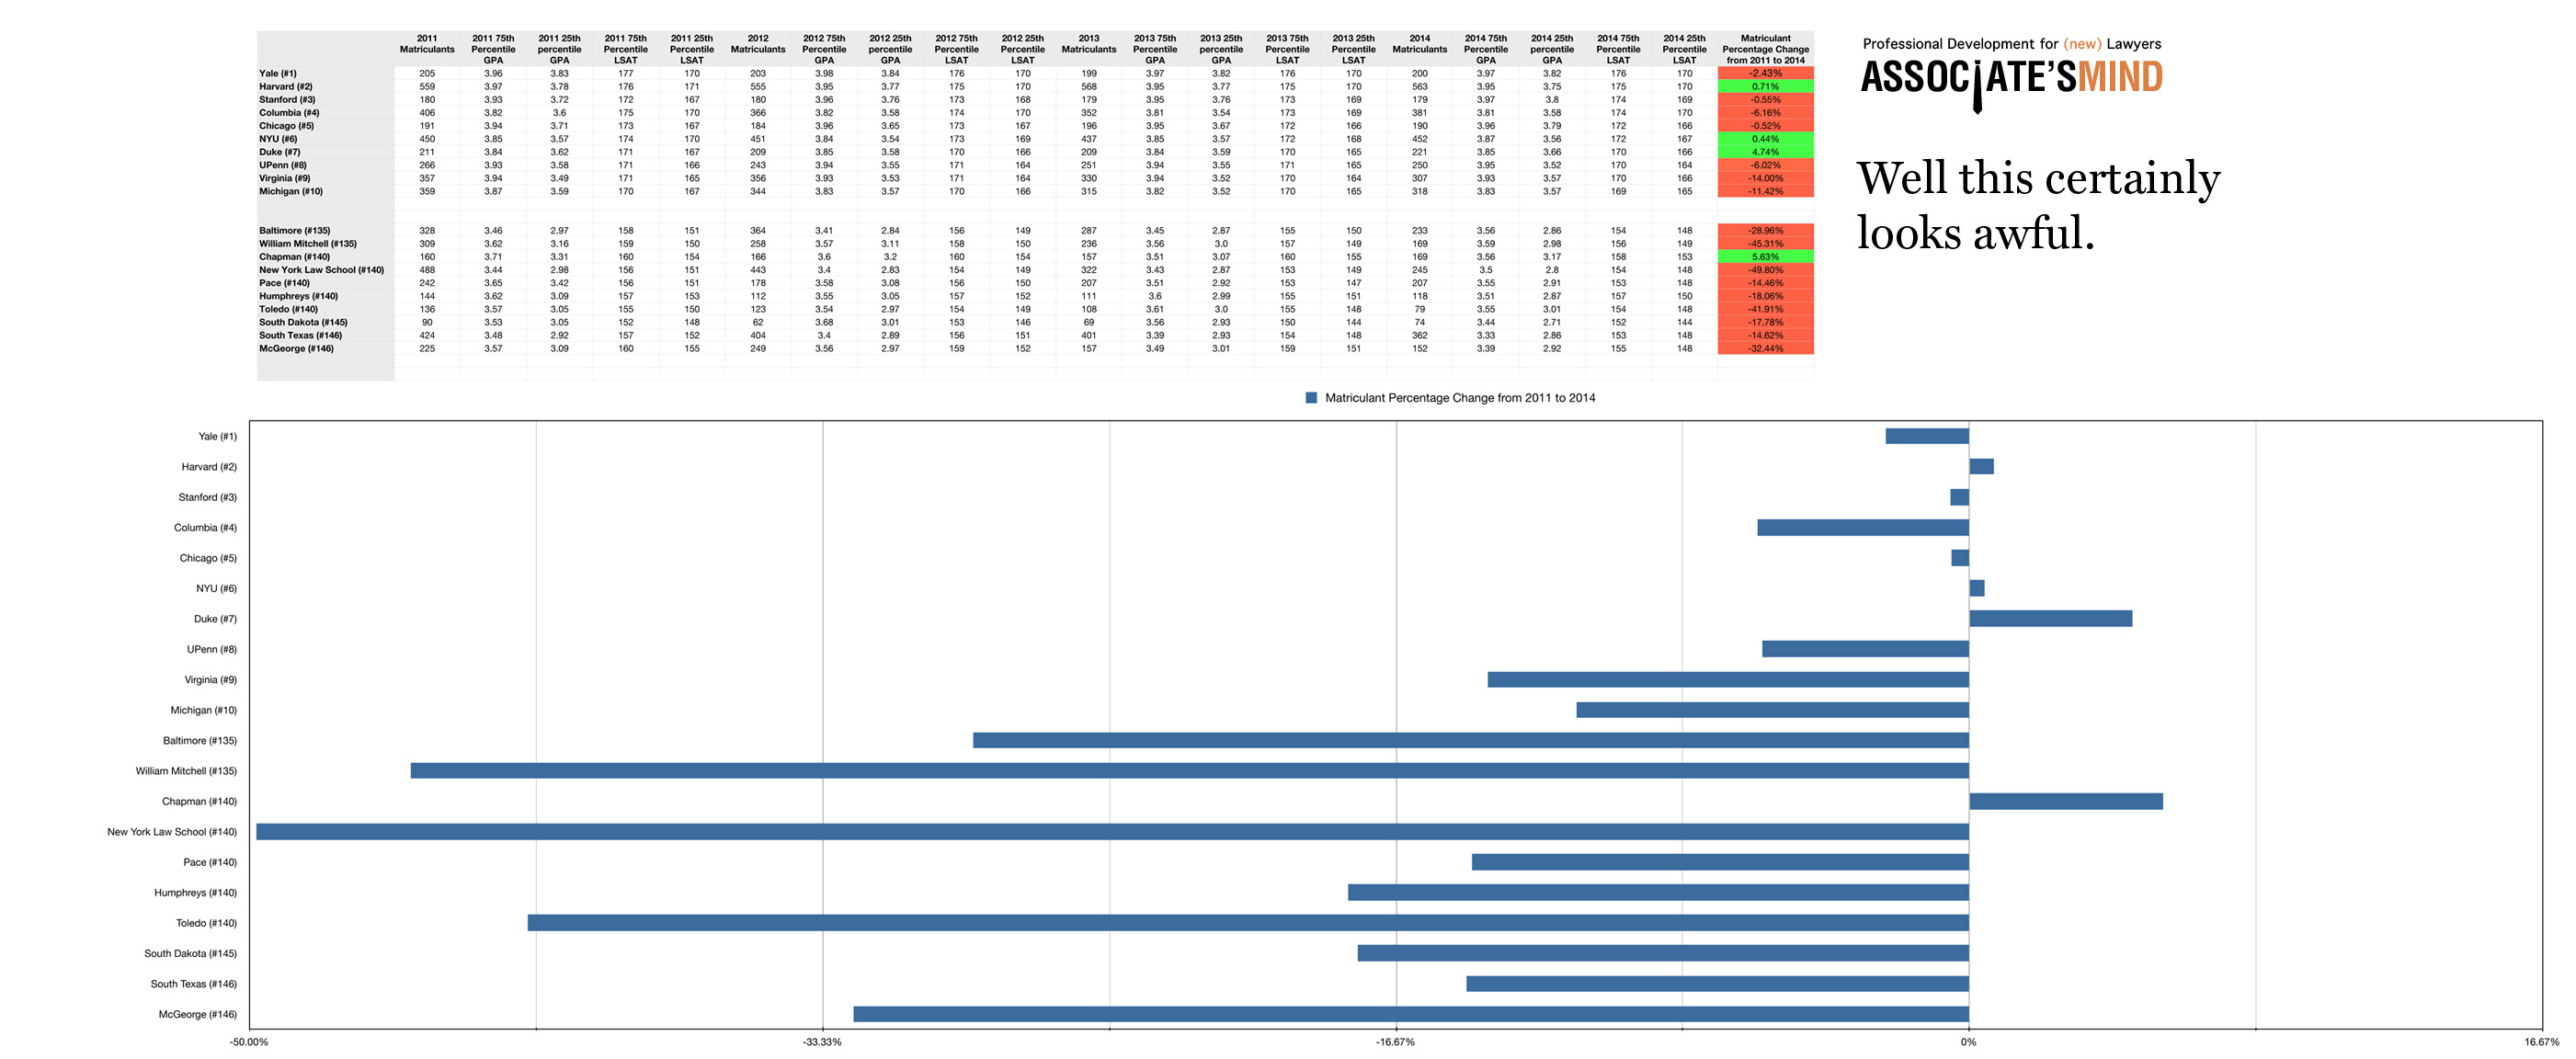
Click for huge version.
Holy precipitous decline Batman! Just look at all that red. I had to make this chart gigantic to fit the huge declines the schools have been facing. Again, it’s much, much worse at the bottom ranked schools, but a few things stand out.
- Virginia and Michigan, the #9 and #10 ranked schools respectively, both have had double-digit percentage decline in matriculants. Is that just tightening the belt a bit or a sign of things to come?
- The bottom ranked schools, with the exception of Chapman, are having a bloodletting. New York Law School has had nearly a 50% decline in matriculants since 2011. That can’t be sustainable.
- This isn’t even taking into account all the “unranked” schools listed by US News & World Reports.
All in all, it looks like the general malaise affecting law schools is going to continue.
__
(As an aside, could the ABA post the data in a more inconvenient way?! Just dump the raw data. We don’t need separate PDFS for every year for every school!)